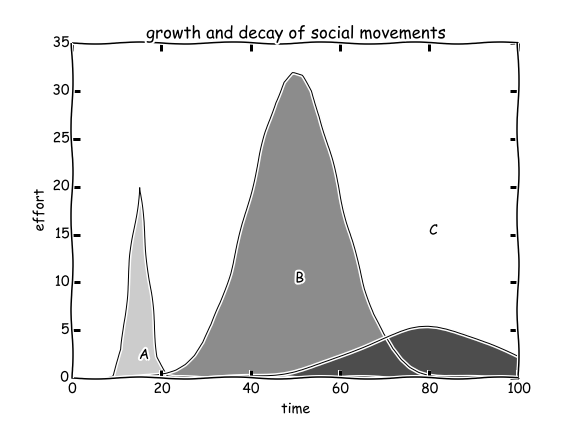
Social movements are different. Some burst and die within several days and some others last for years or even decades. So how can we classify and predict the types of social movements ? Here is an idea. Let’s start from the temporal distribution of social movements:
%pylab inline
plt.xkcd()
directory ='xxx' # define your directory here

fig = plt.figure(figsize=(8, 6),facecolor='white')
ax = fig.add_subplot(111)
x = np.linspace(1,100,50)
parameters = [[15,2,100],[50,10,800],[80,15,200]]
for i,j in enumerate(map(lambda k:mlab.normpdf(x,k[0],k[1])*k[2], parameters)):
    ax.plot(x,j,color='k',lw=1)
    ax.fill_between(x,j,0,color=str(0.8-i*0.25))
    ax.text(parameters[i][0],parameters[i][1],chr(65+i))
ax.set_xlabel('time')
ax.set_ylabel("effort")
ax.set_title('growth and decay of social movements')
plt.savefig(directory+'bell.png')
plt.show()
As seem in the above figure, a social movement is characterized by two main factors, time span and efforts invested by the participants. There can be various measures of the efforts invested into a given movement, such as the number of tweets on Twitter or the number of clicks on Youtube.
Actually, we can slightly modify the scheme of the above figure and turn it into something more understandable:
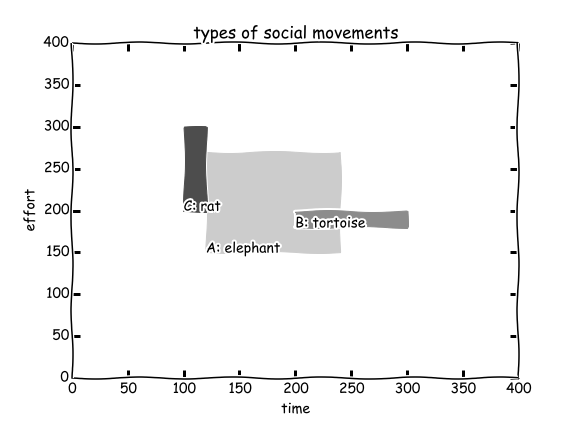
fig = plt.figure(figsize=(8, 6),facecolor='white')
ax = fig.add_subplot(111)
names = ['elephant','tortoise','rat']
parameters = [[120,150,120,120],[200,180,100,20],[100,200,20,100]]
for i,j in enumerate(parameters):
    rect = plt.Rectangle((j[0],j[1]),j[2],j[3],color=str(0.8-i*0.25))
    ax.add_patch(rect)
    ax.text(j[0],j[1],chr(65+i)+': '+names[i])
ax.set_xlabel('time')
ax.set_ylabel("effort")
ax.set_title('types of social movements')
ax.set_xlim([0, 400])
ax.set_ylim([0, 400])
plt.savefig(directory+'rect.png')
plt.show()
Now we can easily tell the differences between social movements. There are rat, tortoise, and elephant. The factors related to these types goes beyond the scope of this blog, but worth further exploration.
How to probe into the mesoscopic dynamics of the social movements, concerning their types ? One way to do this is to look into the flow networks of collective attention. Let’s consider social movement as “Collaborative Narrative” in a “word space”. Participants enter into this space and generate individual clickstreams (a sequence of words) to express their statement. The individual clickstreams (statements of individual participants) and the background structure (opinion climate) interact with each other and evolves together, leading to the emergence of consensus. It is not always a bad thing that a social movement decays - the reason may be that its statement has already been widely accepted.
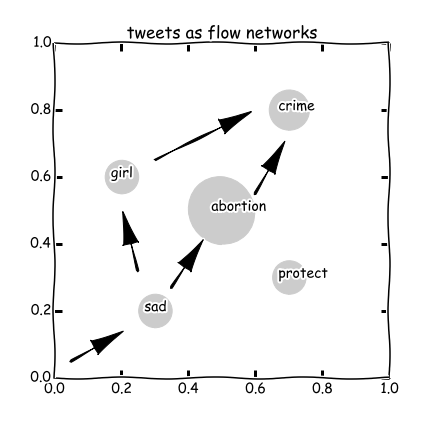
fig = plt.figure(figsize=(6, 6),facecolor='white')
ax = fig.add_subplot(111)
tags = ['abortion','girl','protect','crime','sad']
x = [0.5,0.2,0.7,0.7,0.3]
y = [0.5,0.6,0.3,0.8,0.2]
gray = ['0.8']*5
dx = [0.1,0.05,0.05,0.06,0.05]
arrowpos = [[0.35, 0.27, 0.04, 0.06],
       [0.05, 0.05, 0.07, 0.04],
       [0.25, 0.32, -0.02, 0.08],
       [0.3, 0.65, 0.2, 0.1],
       [0.6, 0.55, 0.04, 0.07],
       [0.57, 0.42, 0.02, -0.02]]
for x, y, g, r, t, ap in zip(x, y, gray, dx, tags, arrowpos):
    circle = plt.Circle((x, y), r, color=g)
    ax.add_artist(circle)
    ax.text(x-0.03,y,t)
    ax.arrow(ap[0],ap[1],ap[2],ap[3],fc="k", ec="k",head_width=0.05, head_length=0.1)
ax.set_title('tweets as flow networks')
plt.savefig(directory+'network.png')
plt.show()
We call this method attention network analysis. It can be applied to analyze various of collective human activities. We will show in further blogs how to apply this framework to analyze social movements on Twitter, Wiki, and Youtube.