In a previous blog we gave the following plots as a framework to study social movements online.
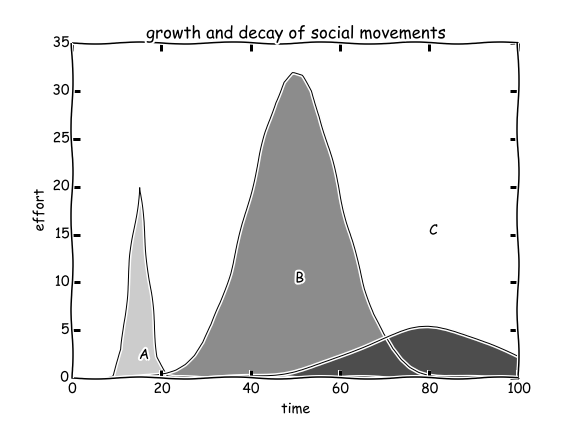
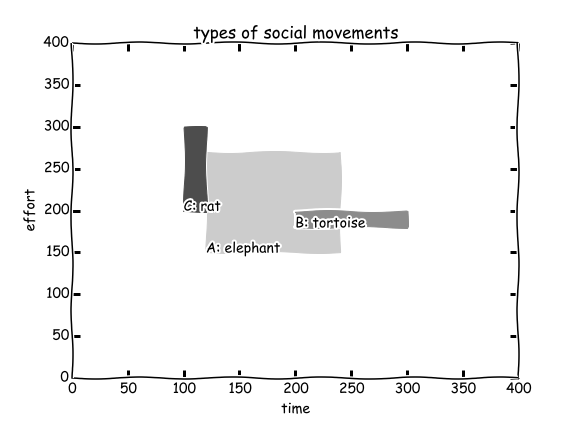
In this blog we will present the result of our exploration.
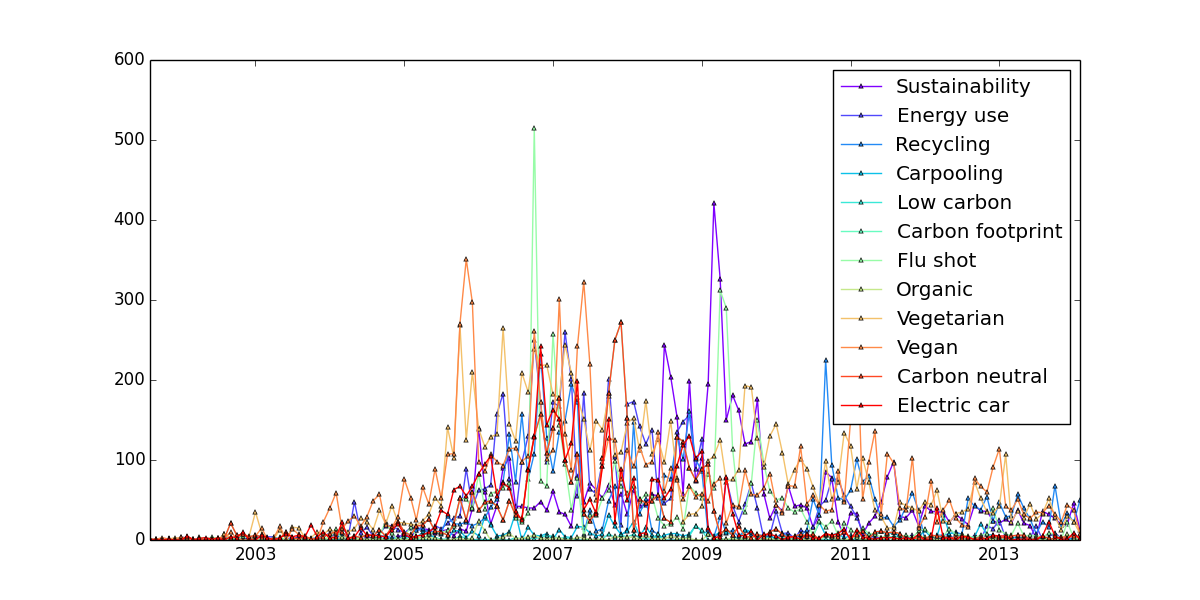
In Wikimedia Tool Labs you can review the edit history of wiki pages. We wrote python scripts to download the result of a series of keywords/wikipages related to environmental issues. The following figure shows the monthly edits on this wikipages.
from bs4 import BeautifulSoup
import urllib2
import numpy as np
from datetime import datetime
import matplotlib
import matplotlib.pyplot as plt
import random
import time
import matplotlib.cm as cm
import re

ks = ['Sustainability','Energy use','Recycling','Carpooling','Low carbon',
  'Carbon footprint','Flu shot','Organic','Vegetarian',
  'Vegan','Carbon neutral','Electric car']
directory = 'define your own directory'

def plotEdits(ax,keyword,col,lab):
    url = 'http://tools.wmflabs.org/xtools/articleinfo/index.php?article='+keyword+'&lang=en&wiki=wikipedia'
    html = urllib2.urlopen(url).read()
    time.sleep(random.random())
    soup = BeautifulSoup(html)
    s=soup.body.findAll('table', {"class" : "months wikitable"})[1]
    data=[ [i.string,i.parent.findAll('td')[1].string]  for i in s.findAll('td', {"class" : "date"})]
    data=np.array([[datetime.strptime(x, '%m/%Y'),int(y)] for x,y in data])
    x,y=(matplotlib.dates.date2num(data[:,0]),data[:,1])
    ax.plot_date(x,y,marker='^',markersize=3,linestyle='-',color=col,label=lab)

fig = plt.figure(figsize=(12, 6),facecolor='white')
ax=fig.add_subplot(111)
l = len(ks)
cmap = cm.get_cmap('rainbow', l)
for i in range(l):
    print i
    plotEdits(ax,ks[i],cmap(i),ks[i])
    plt.legend( loc='upper right', numpoints = 1 )
fig.savefig(directory + 'wikiedit.png')
plt.show()
If you’ve heard ‘edit war’, you would assume that the number of edits is a proxy of the controversiality of issues. If we accept this assumption, we will find that among the studied keywords ‘Carbon footprint’ and ‘flu shot’ is the two most controversial issues. This observation is consistent with our exploration on Twitter.
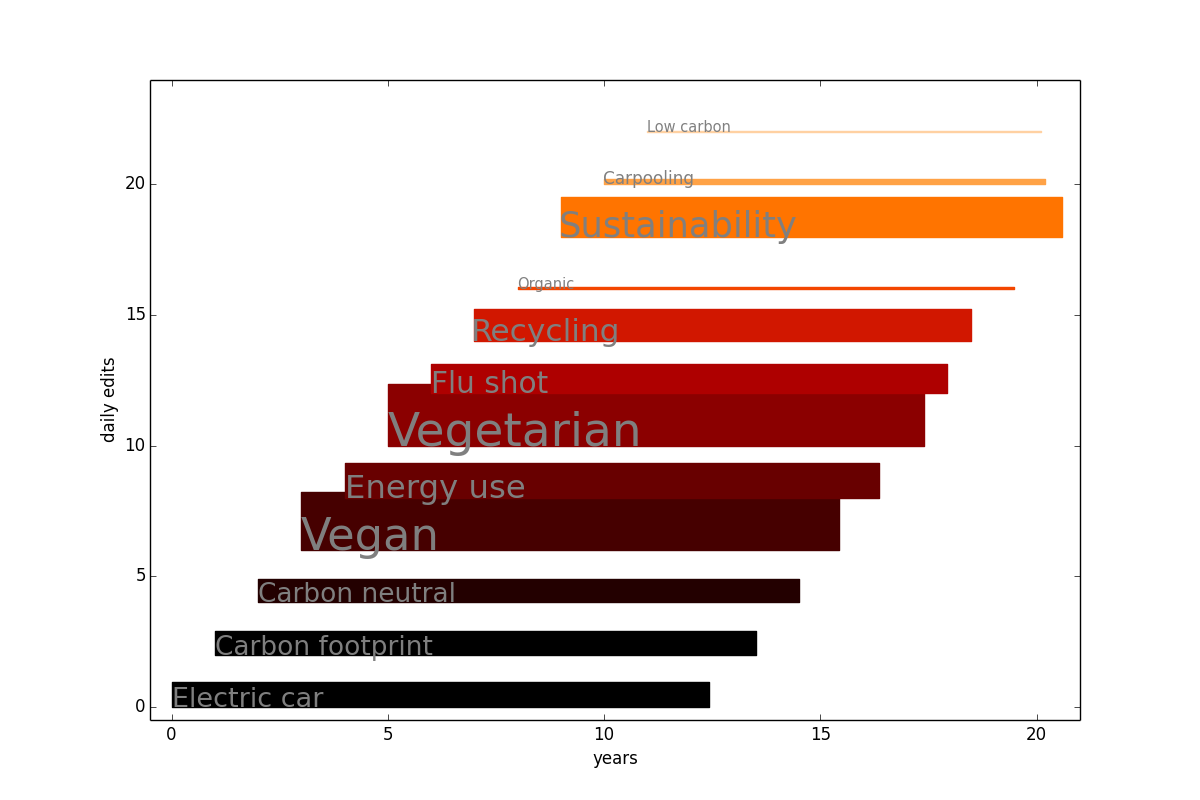
We can also plot the number of averaged daily edits against the time span of issues, as shown above. Putting together this figure and the last one, we can differentiate the issues that burst and die in a short time period (or are lack of controversiality, such as low carbon and car pooling) from the issues that remain active or controversial during the entire editing history (such as vegetarian).
def getStat(keyword):
    url = 'http://tools.wmflabs.org/xtools/articleinfo/index.php?article='+keyword+'&lang=en&wiki=wikipedia'
    html = urllib2.urlopen(url).read()
    time.sleep(random.random())
    soup = BeautifulSoup(html)
    s=soup.body.findAll('table', {"class" : "months wikitable"})[1]
    begin=s.findAll('td', {"class" : "date"})[0].string
    begin=datetime.strptime(begin, '%m/%Y')
    data=soup.body.findNext('table')
    data=data.findAll('td')
    tedit=int(re.sub(r'[^\w]', '',  data[3].string))
    dayinterval = float(re.split(' ',data[13].string)[0])
    days = tedit*dayinterval
    dailyedit = 1/dayinterval
    return [begin,days,dailyedit]

st={}
for i in ks:a
    print ks.index(i)
    st[i]= getStat(i)
ts=sorted(st.items(),key=lambda x:x[1])

l = len(ts)
cmaprect = cm.get_cmap('gist_heat', l)
fig = plt.figure(figsize=(12, 8),facecolor='white')
ax = fig.add_subplot(111)
for i in range(l):
    rect = matplotlib.patches.Rectangle((i,i*2), ts[i][1][1]/365, ts[i][1][2] ,color=cmaprect(i-1))
    ax.add_patch(rect)
    ax.text(i,i*2,ts[i][0],color='gray',size=ts[i][1][2]*10+10)
plt.xlim([-0.5, 21])
plt.ylim([-0.5, 24])
plt.xlabel('years')
plt.ylabel("daily edits")
plt.savefig(directory + 'wikiedithist.png')
plt.show()