Recently, I saw some satellite night maps and was shocked by their beauty. Then I realized that I can use them as data sets to analyze and model the spatial distribution of human activities (wealth, energy consumption), so I did some demo analysis.
If you are interested in this direction and want to turn it into a “formal” study, you can look into the NOAA and NASA data sets, which contain the worldwide maps covering 20 years (1992-2012).
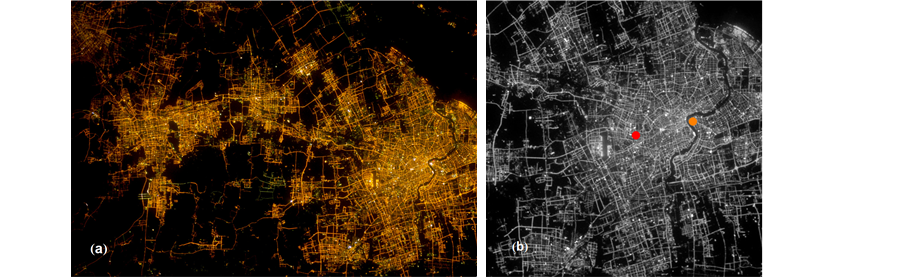
Fig.1 The map of Shanghai (a) and its economic center (b, obtained by calculating the “gravity center” of pixel lightness).
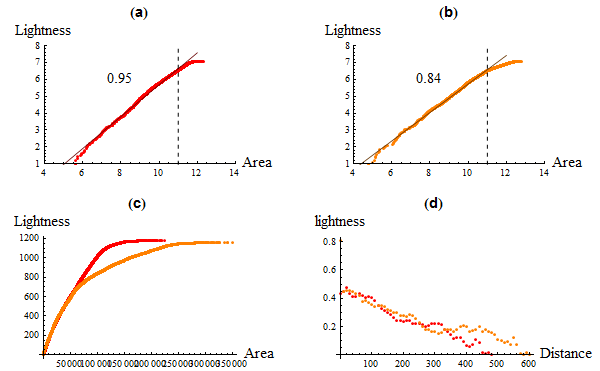
Fig.2 Some analysis on the spatial distribution of human (energy consuming) activities.

Fig. 3 Detecting the cities (or economic areas) of the U.S. based on pixel lightness and connectivity.
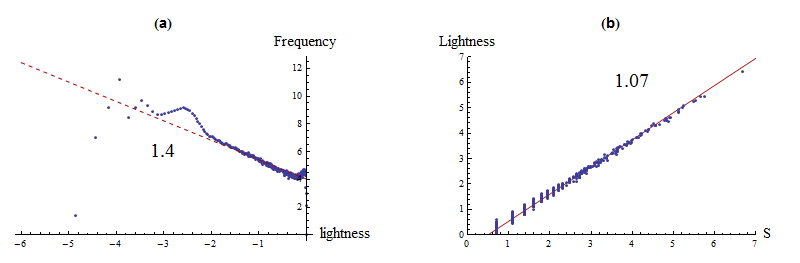
Fig.4 Analysis of the collective energy consumption behavior of U.S. cities (detected in Fig. 3). (a) shows the distribution of energy consumption of cities and (b) shows how the energy consumption growth with the size of cities.
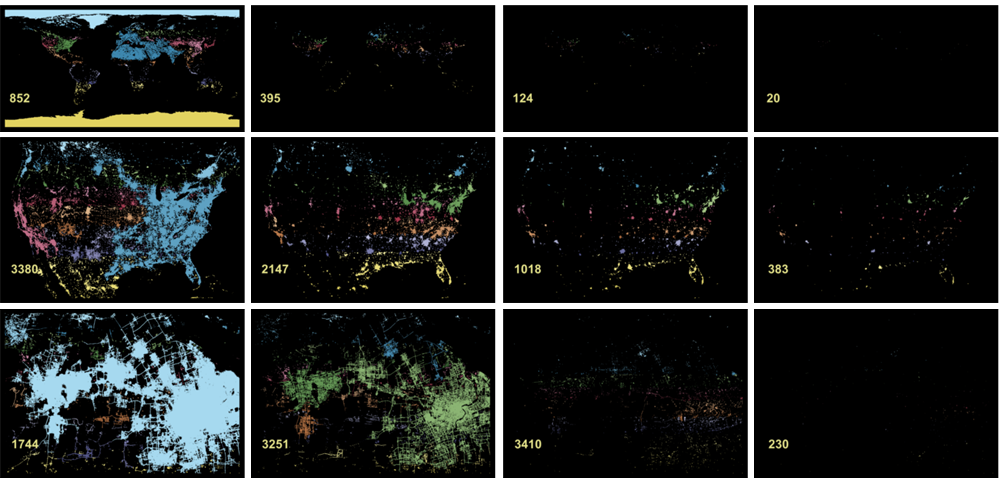
Fig. 5 The city (economic area) detection algorithm applied on the world map, the U.S. map, and the map of Shanghai. The number of cities (economic areas) (denoted in the lower left corner of the plots) varies when we change the parameter of algorithm.
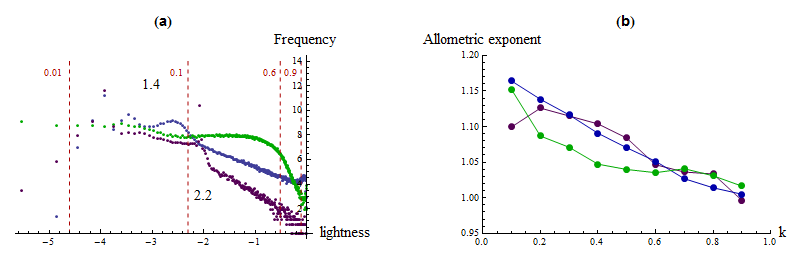
Fig. 6 Comparisons between the world (purple), U.S.(blue), and Shanghai(green) in terms of energy consumption distribution (a) and the scaling of energy with city size (b). The scaling exponent may vary if we adjust the parameter in city detection algorithm, and the scaling laws remain the same.
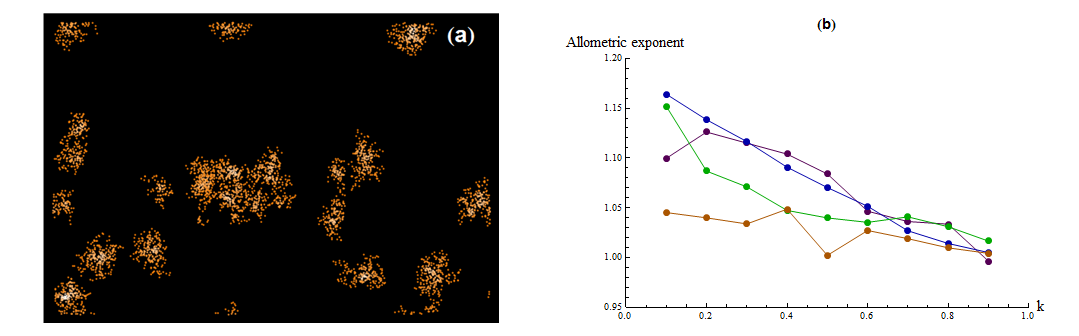
Fig. 7. An agent-based model on city growth that replicates the observed scaling laws of energy consumption of cities. The model is described in this paper in details.