Recently, Yelp! released a data set for academic research. This data sets includes the 335,022 reviews from 70,817 users to 15,585 businesses from greater Phoenix, AZ metropolitan area. I downloaded this data set and played around with it.
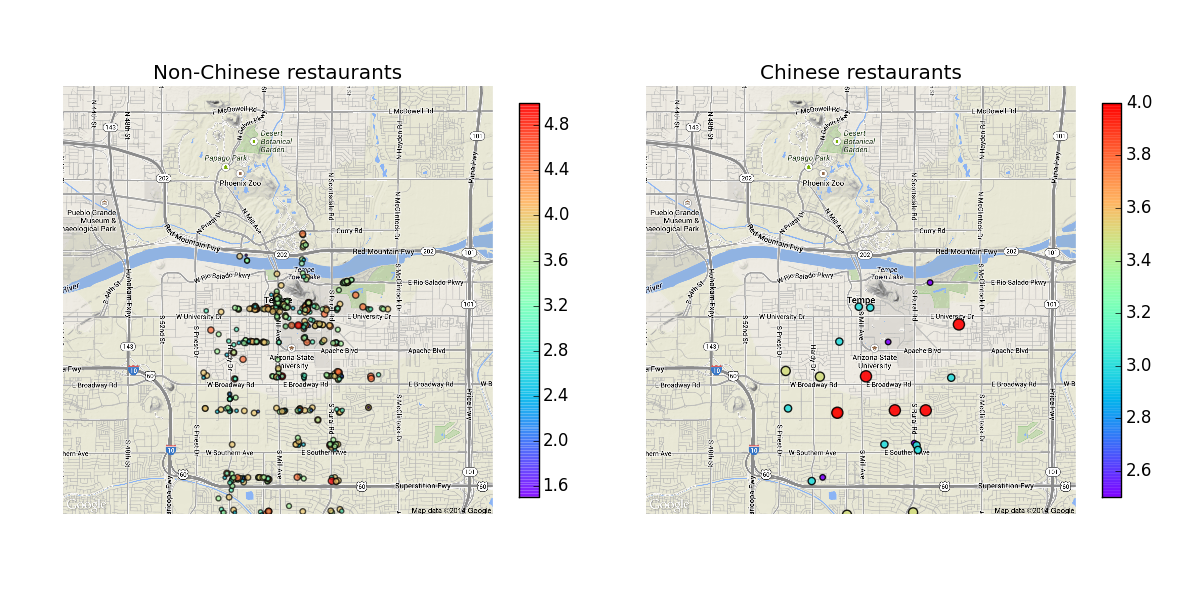
The above figure shows a very naive analysis. I select Tempe restaurants from the businesses and pinned them on Google map. The size and the color of the scatters are proportional to their popularity, i.e., stars.
The mean value and standard deviation of the 501 non-Chinese restaurants are 3.44 and 0.67, respectively, and the two values for the 25 Chinese restaurants are 3.30 and 0.53, respectively. So unfortunately, the average popularity of Chinese restaurants is less than that of non-Chinese ones. Did they went to the kitchens of these Chinese restaurants ? Maybe a text mining would reveal the answer.
So what are the “best” and the “worst” Chinese restaurants ? Miu’s Cuisine has 75 votes and 4 stars. I visited their site and found this:

This is dry sauteed string beans. Classical Sichuan (a southeast province of China) flavor. I like it.
Genghis Grill has 18 votes and 2.5 satrs - it is updated to 3.5 stars now. They provide this
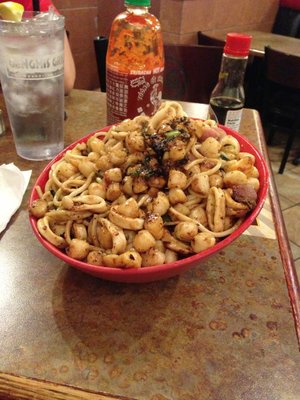
It is said to be a mixture of “scallops, bacon, calamari, and curry sauce”. As a Chinese, I have never seem this before in my life and I am not sure I want to have a try.
from cStringIO import StringIO
import Image
import urllib
import matplotlib.pyplot as plt
import json
from mpl_toolkits.basemap import Basemap
import numpy as np
import matplotlib.cm as cm
#get google map with two parameters: center and scale
clat,clon = 33.42551,-111.940005 # Tempe
# find centers: http://gmaps-samples.googlecode.com/svn/trunk/geocoder/singlegeocode.html
center = '33.42551,-111.940005'
s = 13 # zooming scale
url = 'http://maps.googleapis.com/maps/api/staticmap?sensor=false&size=640x640'\
+ '¢er=' + center\
+ '&zoom=' + str(s)\
+ '&scale=2&maptype=terrain'
buffer = StringIO(urllib.urlopen(url).read())
image = Image.open(buffer)
image.save('/Users/csid/Downloads/googlemap.png')
# convert latitude and longitude of shops into pixel position
# see following references
# https://developers.google.com/maps/documentation/ios/views
# http://troybrant.net/blog/2010/01/mkmapview-and-zoom-levels-a-visual-guide/
# https://github.com/tuupola/php_google_maps/blob/master/Google/Maps/Mercator.php
# convert latitude and longtitude into pixels on google map
def latLonToPixelXY(latitude,longitude,zoomScale):
mapWidth = 256*2**zoomScale+0.0
mapHeight = 256*2**zoomScale+0.0
# get x value
x = (longitude+180)*(mapWidth/360)
# convert from degrees to radians
latRad = latitude*np.pi/180
# get y value
mercN = np.log(np.tan((np.pi/4)+(latRad/2)))
y = (mapHeight/2)-(mapWidth*mercN/(2*np.pi))
return x,y
# project on retrived google map
ncx, ncy = latLonToPixelXY(clat,clon,s)
f = []
for i in e:
nx, ny = latLonToPixelXY(i[0],i[1],s)
f.append([640*2/2 + nx - ncx, 640*2/2 - (ny - ncy), i[2], i[3]])
f = np.array(f)
# plot the figure
fig = plt.figure(figsize=(12, 6),facecolor='white')
cm = plt.cm.get_cmap('rainbow')
im = np.flipud(plt.imread('/Users/csid/Downloads/googlemap.png'))
ax = fig.add_subplot(121)
ax.imshow(im, origin='lower')
plt.axis('off')
#ax.plot(640*2/2,640*2/2,linestyle='',marker='^',color='r')
ax.set_title('Non-Chinese restaurants')
f1 = f[f[:,-1]==0]
fig1 = ax.scatter(f1[:,0],f1[:,1],s=f1[:,2]**2,c=f1[:,2],cmap=cm,alpha=0.7)
ax.set_xlim(0,640*2)
ax.set_ylim(0,640*2)
#plt.axis('off')
#plt.colorbar()
#plt.savefig('/Users/csid/Downloads/yelpmap.png',transparent = True)
plt.colorbar(fig1, ax=ax,shrink=.7, pad=0.05, aspect=20)
ax = fig.add_subplot(122)
plt.axis('off')
ax.set_title('Chinese restaurants')
ax.imshow(im, origin='lower')
#ax.plot(640*2/2,640*2/2,linestyle='',marker='^',color='r')
f2 = f[f[:,-1]==1]
fig2 = ax.scatter(f2[:,0],f2[:,1],s=f2[:,2]**3,c=f2[:,2],cmap=cm,alpha=0.9)
ax.set_xlim(0,640*2)
ax.set_ylim(0,640*2)
plt.colorbar(fig2, ax=ax,shrink=.7, pad=0.05, aspect=20)
plt.tight_layout()
plt.savefig('/Users/csid/Downloads/yelpmap.png', transparent=True)
plt.show()