Participating in a research project supported by a Chinese Mobile company, we got access to the mobile data of 10,000 users (randomly sampled from 20 million users). Here we present some results of data explorations in the data set 20131201.
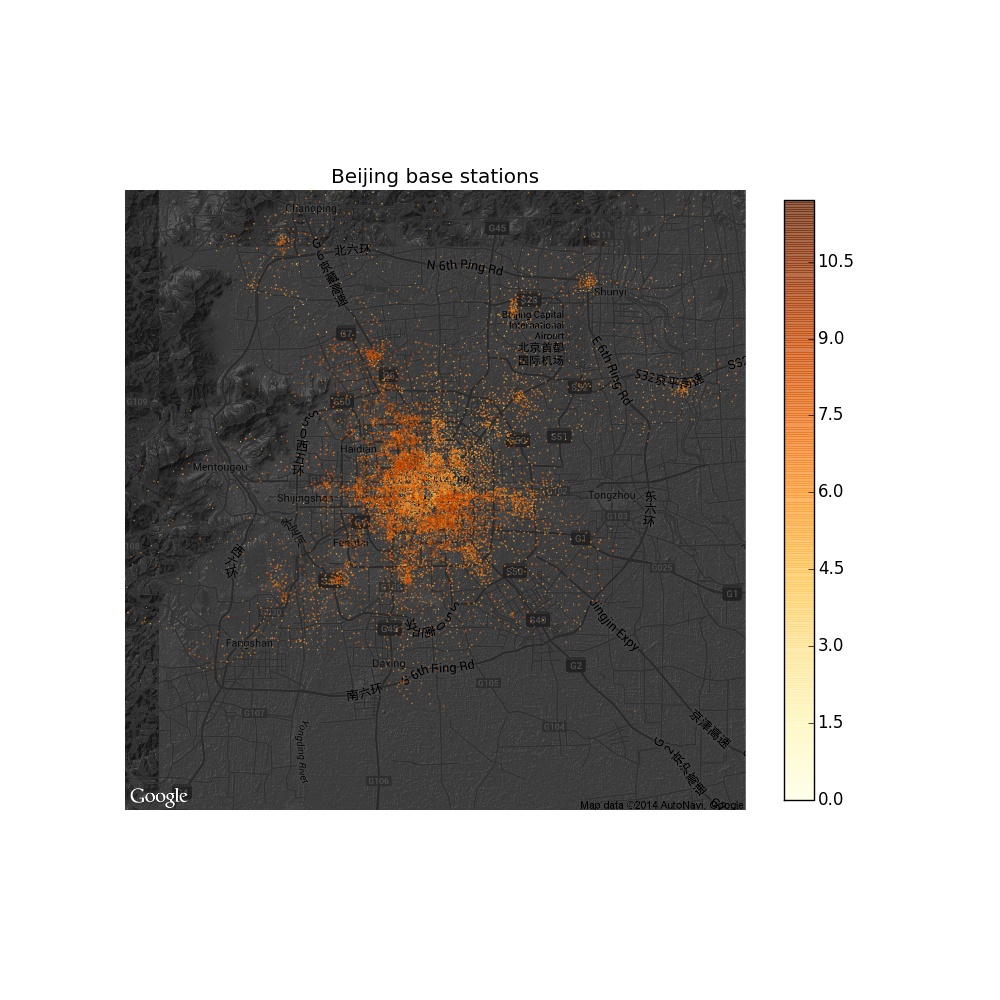
- The spatial and traffic distribution of base stations
The distribution of 14,909 base stations (The darkness of the data points is propotional to the logrithm value of traffic of the base stations).
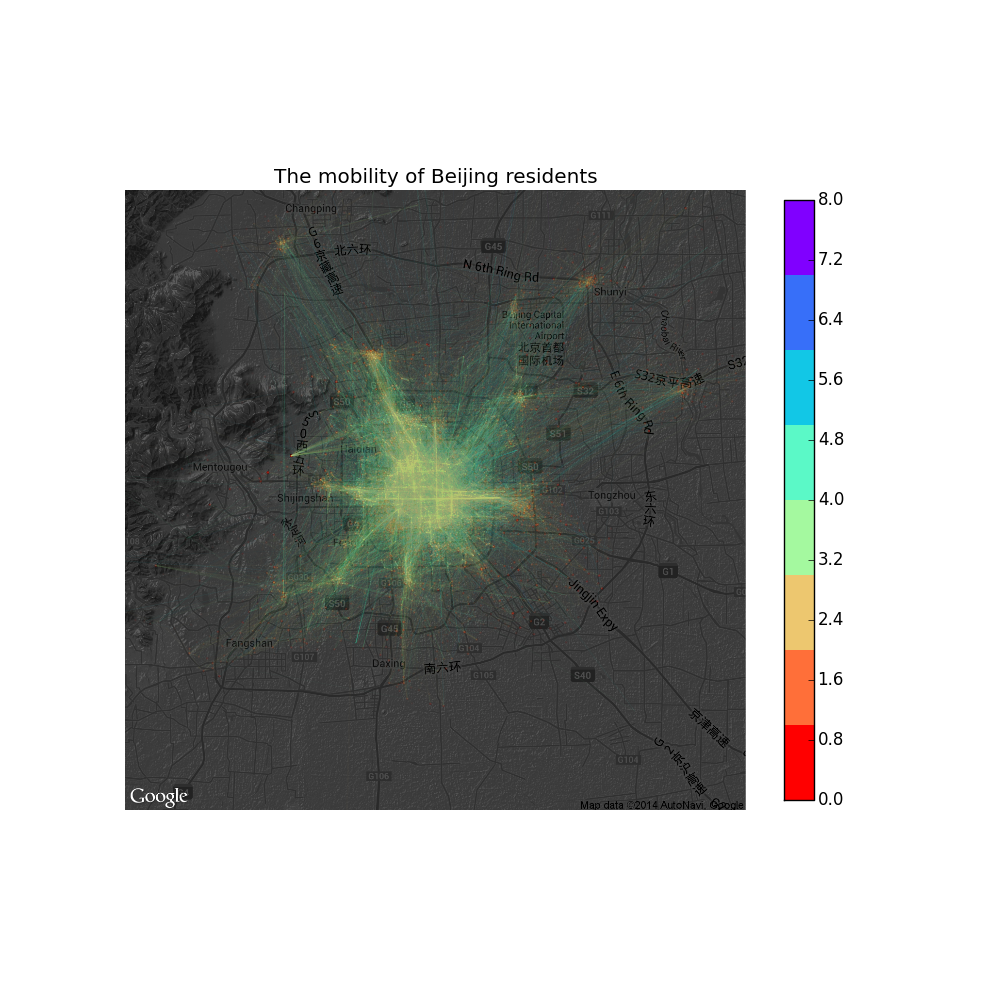
- The mobility of users in the physical and virtual world
For each of the 92,160 users, We calculated the following six variables from their record:
(1) the total number of records (sites/bases);
(2) the number of unique base stations;
(3) the number of sequentially visited stations (any two successive stations are different);
(4) the total distance of navigation on earth surface;
(5) the number of unique sites;
(6) the number of sequentially visited sites;
It turned out that all these variables satisfied power-law distributions. We fitted their power-law exponents using the powerlaw module as shown in the following figure.

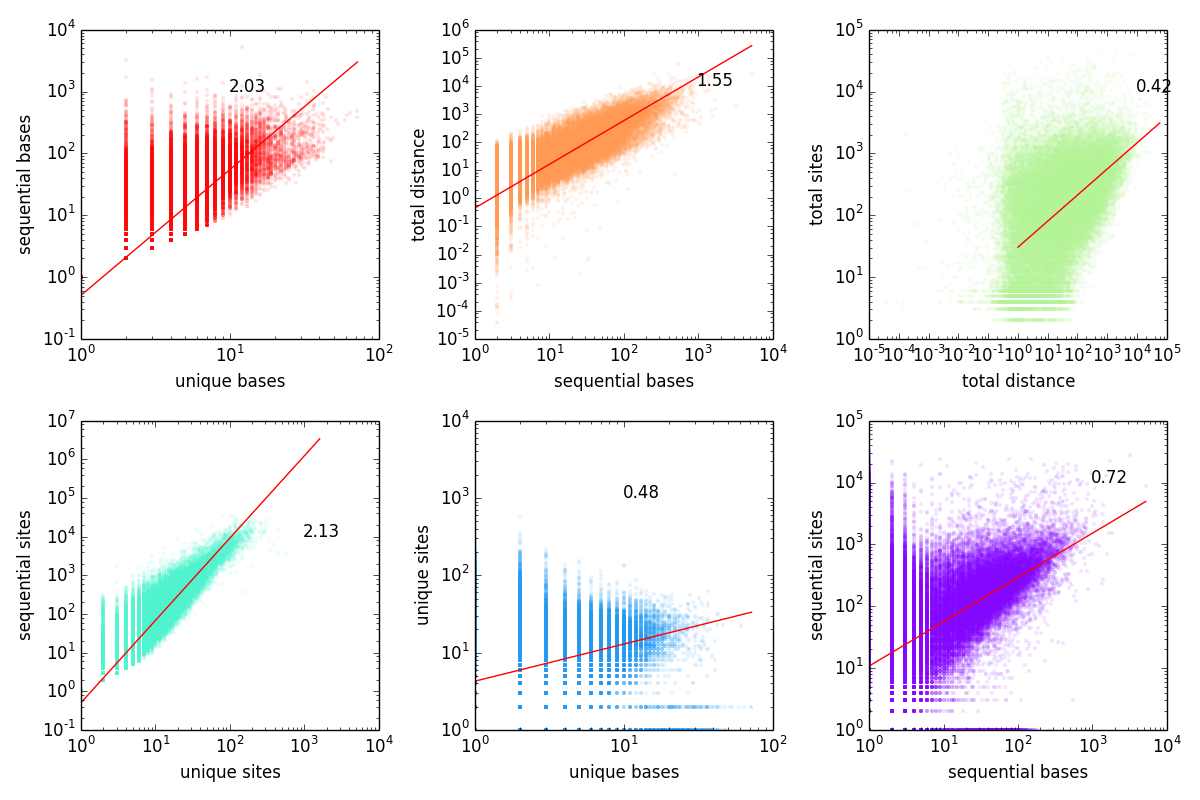
We also found that several pairs of varibales are positively correlated. The correlation between the virtual and real world navigation is interesting.
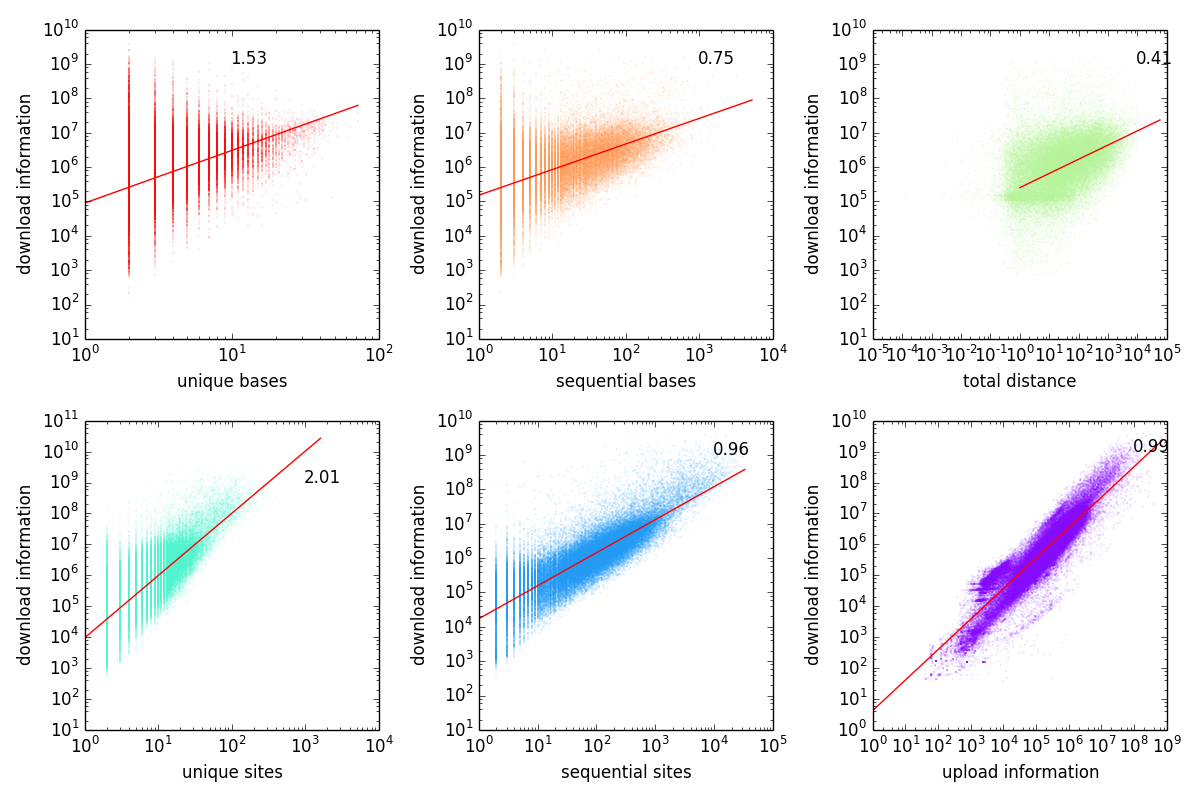
Finnally, we investigated the effect of several variables on the download information in a day.