We will collect the blogs of 23 political writers and clutser them by their usage of words. Here are the result of hierarchical clustering (blue for right wing and red for left wing). It turns out that pearson correlation as the distance gives us more reasonbale result, although the current result is still far from a satisfying level.
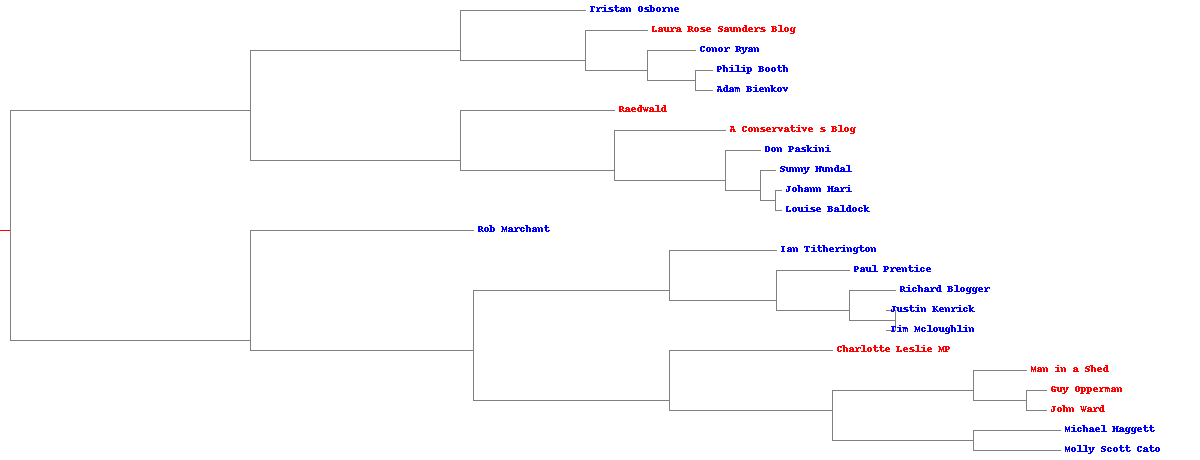 The clustering result using pearson correlation.
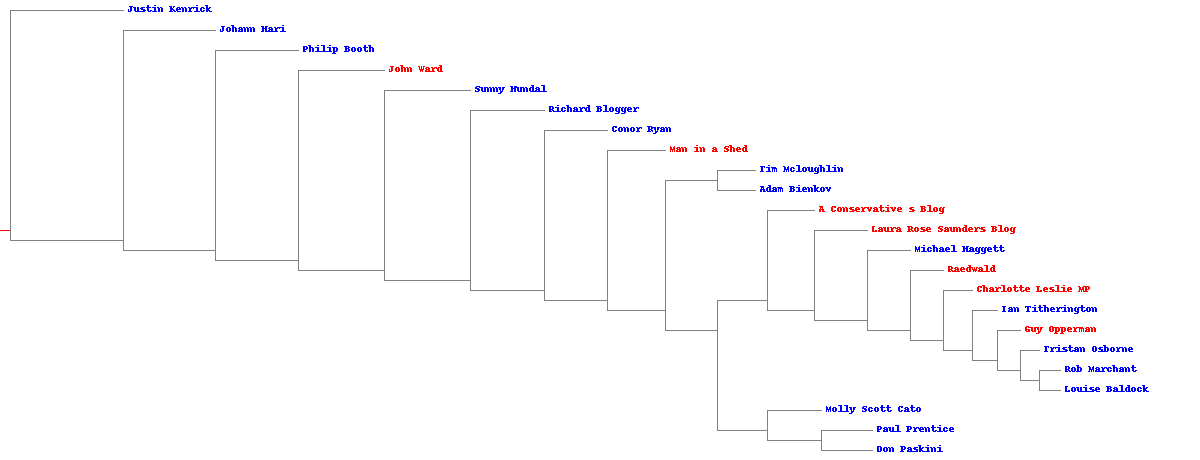 The clustering result using cosine distance.
# import module
import feedparser
import urllib2
import re
from bs4 import BeautifulSoup
from scipy.stats.stats import pearsonr
import numpy as np
import sys
import collections
import matplotlib.pyplot as plt
from PIL import Image,ImageDraw
get RSS feedlist
# get RSS feedlist
urlLeft='http://www.totalpolitics.com/blog/257882/top-75-leftwing-bloggers.thtml'
urlRight='http://www.totalpolitics.com/blog/258477/top-50-conservative-blogs-2011.thtml'
def getUrls(url,label):
    # label: o for left and 1 for right
    html = urllib2.urlopen(url).read()
    soup = BeautifulSoup(html)
    s = soup.body.findAll('div', {"class" : "article-body"})[0]
    d = s.findAll('a')[1:-1]
    clean = lambda s: str(re.sub('[\W_]+', ' ', s)) # remove all nonalphanumeric symbols in a string
    # get home page urls
    U = {}
    for i in d:
        author = clean(i.string)
        if len(author) > 1:
            U[i['href']]=[author,label]
    return U

def processClock(pointer,length):
    frac = np.ceil(pointer*100.0/length)
    sys.stdout.write('\r')
    sys.stdout.write('%d%%' % frac)
    sys.stdout.flush()

def getRSS(urldic):
    R = {}
    for url, authorLabel in urldic.items():
        n = urldic.keys().index(url)
        l = len(urldic)
        processClock(n,l)
        try:
            soup = BeautifulSoup(urllib2.urlopen(url).read())
            rss = soup.find('link', type='application/rss+xml')['href']
            if rss[:len(url)]==url:
                R[rss] = urldic[url]
        except:
            pass
    return R

z = dict(getUrls(urlLeft,0).items() + getUrls(urlRight,1).items())
r = getRSS(z)
with open('/Users/csid/Documents/research/pci_group/feedlist.txt','wb') as f:
    for i in r:
        f.write(i+'\t' + r[i][0] + '\t' + str(r[i][1]) + '\n')
f.close()
prepare word data
# Returns title and dictionary of word counts for an RSS feed
def getwordcounts(url):
    # Parse the feed
    d=feedparser.parse(url)
    wc = collections.defaultdict(lambda: 0)
    # Loop over all the entries
    for e in d.entries:
        if 'summary' in e: summary=e.summary
        elif 'description' in e: summary=e.description
        else: summary = 'a'
        # Extract a list of words
        words=getwords(e.title+' '+summary)
        for word in words:
            wc[word]+=1
    return wc

def getwords(html):
    # Remove all the HTML tags
    txt=re.compile(r'<[^>]+>').sub('',html)
    # Split words by all non-alpha characters
    words=re.compile(r'[^A-Z^a-z]+').split(txt)
    # Convert to lowercase
    return [word.lower() for word in words if word!='']

# feed and author dictionaries
R = {}
N = {}
with open('/Users/csid/Documents/research/pci_group/feedlist.txt','rb') as f:
    for line in f:
        rss, author, label = line.strip().split('\t')
        R[rss] = [author, int(label)]
        N[author] = int(label)
f.close()

#word data
apcount = collections.defaultdict(lambda: 0)
wordcounts={}
for i in R:
    n = R.keys().index(i)
    l = len(R)
    processClock(n,l)
    author = R[i][0]
    wc = getwordcounts(i)
    wordcounts[author]=wc
    for word,count in wc.items():
        if count>1: apcount[word]+=1
wordlist=[]
for w,bc in apcount.items():
    if len(word)>1:
        frac=float(bc)/len(R)
        if frac>0.1 and frac<0.5: wordlist.append(w)


# construct case-feature table
dt=[]
dt.append(['authors']+wordlist)
for author in wordcounts:
    row=[author]
    if sum(wordcounts[author].values())>1000:
        for i in wordlist:
            row.append(str(wordcounts[author][i]))
        dt.append(row)


# save word data
with open('/Users/csid/Documents/research/pci_group/blogdata.txt','w') as f:
    for line in dt:
        f.write('\t'.join(line)+'\n')


# plot the distribution of words and the selected zone
fig = plt.figure(figsize=(6, 4),facecolor='white')
ax = fig.add_subplot(111)
ax.plot(fre,linestyle='',color='c',marker='^',markersize=3,alpha=0.5)
#plt.xscale('log')
ax.vlines(x=len(t)*0.1, ymin=1, ymax=49, linewidth=1, color='orange')
ax.vlines(x=len(t)*0.5, ymin=1, ymax=49, linewidth=1, color='orange')
for i in range(10):
    ax.text(200,48-i*2.5,t[i][0],style='italic',color='brown')
    ax.text(2000,15+i*2.5,t[2000-i][0],style='italic',color='brown')
    ax.text(5000,5+i*2.5,t[5000-i][0],style='italic',color='brown')
ax.set_xlabel('rank')
ax.set_ylabel('frequency')
plt.tight_layout()
plt.savefig('/Users/csid/Documents/githublog/csidsocialmedia.github.io/media/files/\
2014-04-10-Clustering-blogs-by-text/wordfrequency.png',transparent = True)
plt.show()
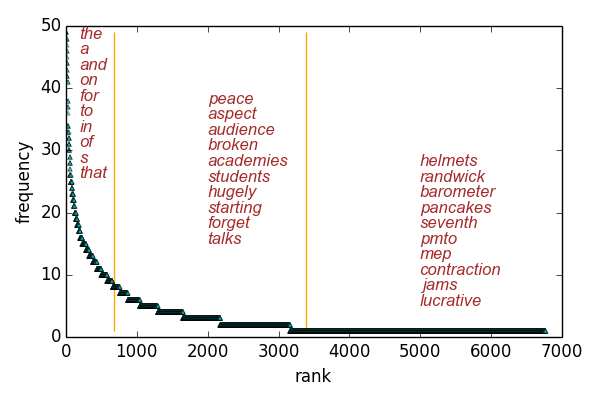 We drop the most common words and uncommon words and use the rest as features.
Hierarchical clustering authors by word frequencies (features)
# read word data
def readfile(filename):
    lines=[line for line in file(filename)]
    # First line is the column titles - excepte the first cell, which is 'author'
    colnames=lines[0].strip( ).split('\t')[1:]
    rownames=[] # authors
    data=[]
    for line in lines[1:]:
        p=line.strip( ).split('\t')
        # First column in each row is the rowname/author
        rownames.append(p[0])
        # The data for this row is the remainder of the row
        data.append(p[1:])
    data = np.array(data).astype(float)
    return rownames,colnames,data


authors,words,data=readfile('/Users/csid/Documents/research/pci_group/blogdata.txt')


#distance functions
def cosine(v1, v2): return 1 - sum(v1*v2) / (sum(v1**2) * sum(v2**2))**0.5 # only takes arrays as input
def pearson(v1,v2): return pearsonr(v1, v2)[0]

# Hcluster object
class bicluster:
    def __init__(self,vec,left=None,right=None,distance=0.0,id=None):
        self.left=left
        self.right=right
        self.vec=vec
        self.id=id
        self.distance=distance

# clustering function
def hcluster(rows,distance=pearson):
    distances={}
    currentclustid=-1
    # Clusters are initially just the rows
    clust=[bicluster(rows[i],id=i) for i in range(len(rows))]
    while len(clust)>1:
        lowestpair=(0,1)
        closest=distance(clust[0].vec,clust[1].vec)
        # loop through every pair looking for the smallest distance
        for i in range(len(clust)):
            for j in range(i+1,len(clust)):
                # distances is the cache of distance calculations
                if (clust[i].id,clust[j].id) not in distances:
                    distances[(clust[i].id,clust[j].id)]=distance(clust[i].vec,clust[j].vec)
                d=distances[(clust[i].id,clust[j].id)]
                if d<closest:
                    closest=d
                    lowestpair=(i,j)
        # calculate the average of the two clusters
        li,lj = lowestpair
        mergevec=(clust[li].vec+clust[lj].vec)/2.0
        # create the new cluster
        newcluster=bicluster(mergevec,left=clust[li], right=clust[lj], distance=closest,id=currentclustid)
        # cluster ids that weren't in the original set are negative
        currentclustid-=1
        del clust[lj]
        del clust[li]
        clust.append(newcluster)
    return clust[0]


clust=hcluster(data)


def getheight(clust):
    # endpoint height = 1 and branch height = sum of sub-branch heights
    if clust.left==None and clust.right==None: return 1
    return getheight(clust.left)+getheight(clust.right)

def getdepth(clust):
    # The distance of an endpoint is 0.0 and the distance of a branch is the greater of its two sides
    # plus its own distance
    if clust.left==None and clust.right==None: return 0
    return max(getdepth(clust.left),getdepth(clust.right))+clust.distance

def drawdendrogram(clust,labels,png='clusters.png'):
    # height and width
    h=getheight(clust)*20
    w=1200
    depth=getdepth(clust)
    # width is fixed, so scale distances accordingly
    scaling=float(w-150)/depth
    # Create a new image with a white background
    img=Image.new('RGB',(w,h),(255,255,255))
    draw=ImageDraw.Draw(img)
    draw.line((0,h/2,10,h/2),fill=(255,0,0))
    # Draw the first node
    drawnode(draw,clust,10,(h/2),scaling,labels)
    img.save(png,'PNG')

def drawnode(draw,clust,x,y,scaling,labels):
    if clust.id<0:
        h1=getheight(clust.left)*20
        h2=getheight(clust.right)*20
        top=y-(h1+h2)/2
        bottom=y+(h1+h2)/2
        # Line length and color
        ll=clust.distance*scaling
        lc = 'gray'
        # Vertical line from this cluster to children
        draw.line((x,top+h1/2,x,bottom-h2/2),lc)
        # Horizontal line to left item
        draw.line((x,top+h1/2,x+ll,top+h1/2),lc)
        # Horizontal line to right item
        draw.line((x,bottom-h2/2,x+ll,bottom-h2/2),lc)
        # Call the function to draw the left and right nodes
        drawnode(draw,clust.left,x+ll,top+h1/2,scaling,labels)
        drawnode(draw,clust.right,x+ll,bottom-h2/2,scaling,labels)
    else:
        # If this is an endpoint, draw the item label
        author = labels[clust.id]
        if N[author]==0:
            c = 'blue'
        else:
            c = 'red'
        draw.text((x+5,y-7),author,c)


drawdendrogram(clust,authors,png='/Users/csid/Documents/research/pci_group/blogclust_pearson.png')
K clustering authors by word frequencies (features)
import random

def kcluster(rows,distance=pearson,k=3):
    # Determine the minimum and maximum values for each point
    ranges = [(i.min(),i.max()) for i in rows.T]
    # Create k randomly placed centroids
    centers = [[random.uniform(i[0], i[1]) for i in ranges] for j in range(k)]
    lastClusters=None
    for t in range(100):
        # counter
        sys.stdout.write('\r')
        sys.stdout.write( 'Iteration %d' % t)
        sys.stdout.flush()
        clusters=[[] for i in range(k)]
        # Find which centroid is the closest for each row
        for j in range(len(rows)):
            closest = np.array([distance(rows[j],i) for i in centers]).argmin()
            clusters[closest].append(j)
        # stop when the results are the same, otherwise update and continue
        if clusters==lastClusters: break
        lastClusters=clusters
        # Move the centroids to the average of their members
        for i in range(k):
            if len(clusters[i])>0:
                avg = np.mean(np.array([rows[q] for q in clusters[i]]),axis=0)
                centers[i] = avg
    return clusters


kclust=kcluster(data,k=2)


[(authors[i],N[authors[i]])for i in kclust[0]]+[(authors[i],N[authors[i]])for i in kclust[1]]