A competition-based method for measuring question difficulty
Invented as an improved chess rating system, Elo rating system is widely used in games and team sports. Herbrich et al. from Microsoft Research (Cambridge) developed the TrueSkill rating system by combining Elo’s method with Bayesian inference and applied it in macthing competitors for Xbox online game (e.g., Halo 2) players [1]. Liu Jing et al. from Harbin Institute of Technology (China) and Microsoft Research (Asia) applied the TrueSkill rating system to estimate the difficulties of questions and the expertise experts in online Q&A communities [2][3]. They showed that this method overperforms other structure-based analysis such as the page rank of user network [4].
TrueSkill system, assumes that the ‘true skill’ of each player in a game follows a normal distribution with mean mu and variance sigma. And them the system update these distributions by the competition results. In particular, the system consider the current skill of two players (priori probability) and the winner-loser result (likelihood) to update the player skill levels (posterior probability).
in which
N and Phi in Eq.(7) stand for the PDF and CDF of standardized normal distribution, respectively.
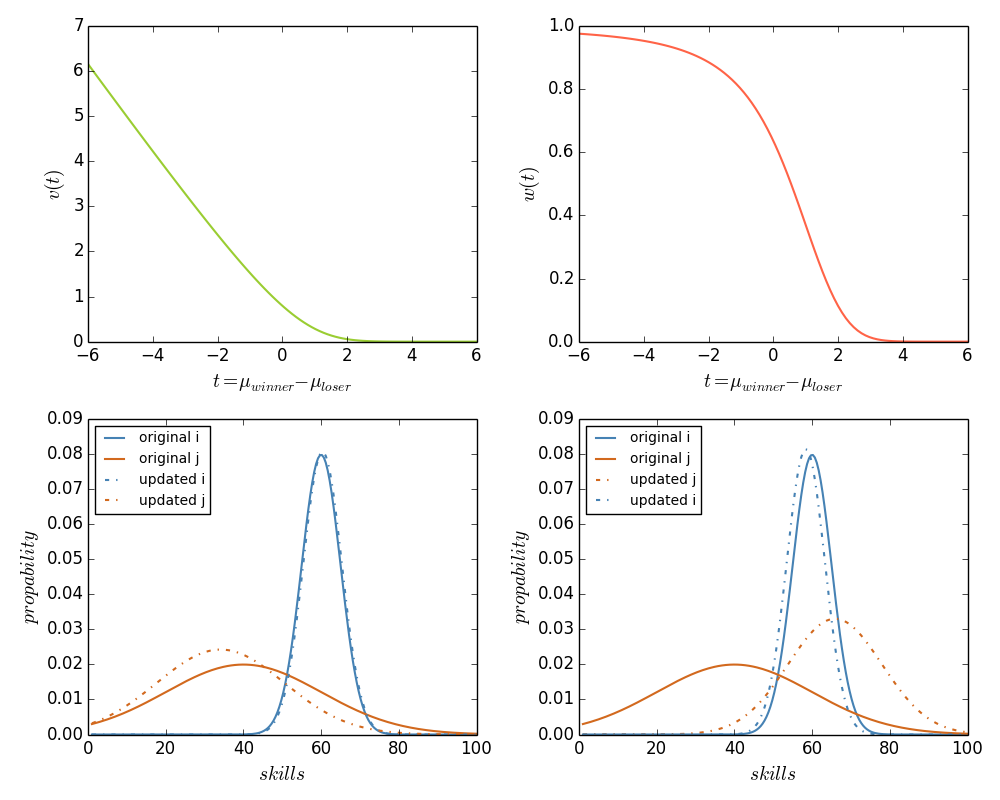
From the above functions we know that TrueSkill updates the skill level mu and the uncertainty sigma intuitively. If the competition outcome is expected: the player of higher skill level wins, the system will updates mu and sigma slightly in positive direction (Matthew effect). On the contrary, if the outcome is unexpected, i.e. the player of lower skill level wins, the system will updates mu and sigma greatly in negative direction. The parameter beta controls the updating effect, larger beta leads to more dramatically changes. The following figure visualizes the effects of updating rules and two exmaple results. The two plots in the upper row show how updates increase with surprise (smaller t) and the two plots in the lower row compare the updating between expected (left) and unexpected (right) outcomes.
The difficulties of questions on stackoverflow (SO)
We applied TrueSkills to the lastest dump of SO data, which contains over 18 millions of records (both of questions and anwsers) last from July, 2008 to January, 2014. After removing the questions that did not have accepted answers, there were near 4 million questions and 11 million answers.
For each question, we collect all related answers and define four types of game players: asker, question, accepted answerer, non-accepted answerers. We extract the following four kinds of outcome (here we use “>” to connect the winner and the loser):
			question > asker                   (I)

   accepted answerer > question                (II)

   accepted answerer > asker                   (III)

   accepted answerer > non-accepted answerer1  (IV)
   accepted answerer > non-accepted answerer2
   ...
   accepted answerer > non-accepted answererk
At first, we set the initial value of mu = 25, sigma = 25/3, and beta = sigma/2 the same to all players (these are the values in applying the TrueSkill in xbox games) and then updated the values of winners and losers across the 11 million pairs of players. After we got the result we calculated miu-3sigma as the stable score for palyer (we add 10 for each score to make sure all scoare are positve). This method not only quantifies the difficulties of questions and the skill levels of users at the same time, but also allows one to compare the the expertise of an user with the difficulties of the questions he chosed to answer and thus provides the tools to investigate individual strategies. But first of all, we may want to validate the resulting score.
![]()
The left plot of the above figure shows the distribution of TrueSkill scores of 0.7 million users (green) and 4 million questions (orange). And the right plot shows the correlation between the TrueSkill scores of users and their reputation score (10 k users sampled from the population). Reputation is the score a user earns/loses by the voting of browsers, thus can be used as an indicator for the skill level of users to validate our data. We find that the TrueSkill score and the reputation of users are closely correlated (pearson correlation coefficient 0.29, p-value < 0.001, regression coefficient 0.14), supporting the usage of TrueSkill as a rating method.
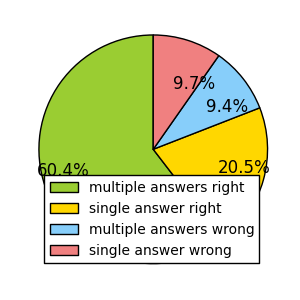
Now we can analyze the different strategies of users
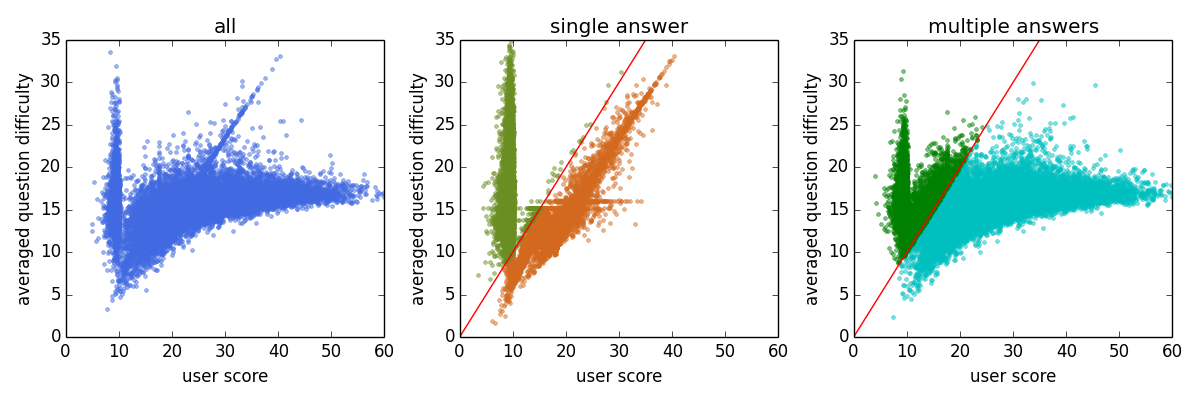
There are four different types of behaviors … (to be continued)
The conservation law of human attention