

Figure by Nelson
Why natural flow networks are so beautiful
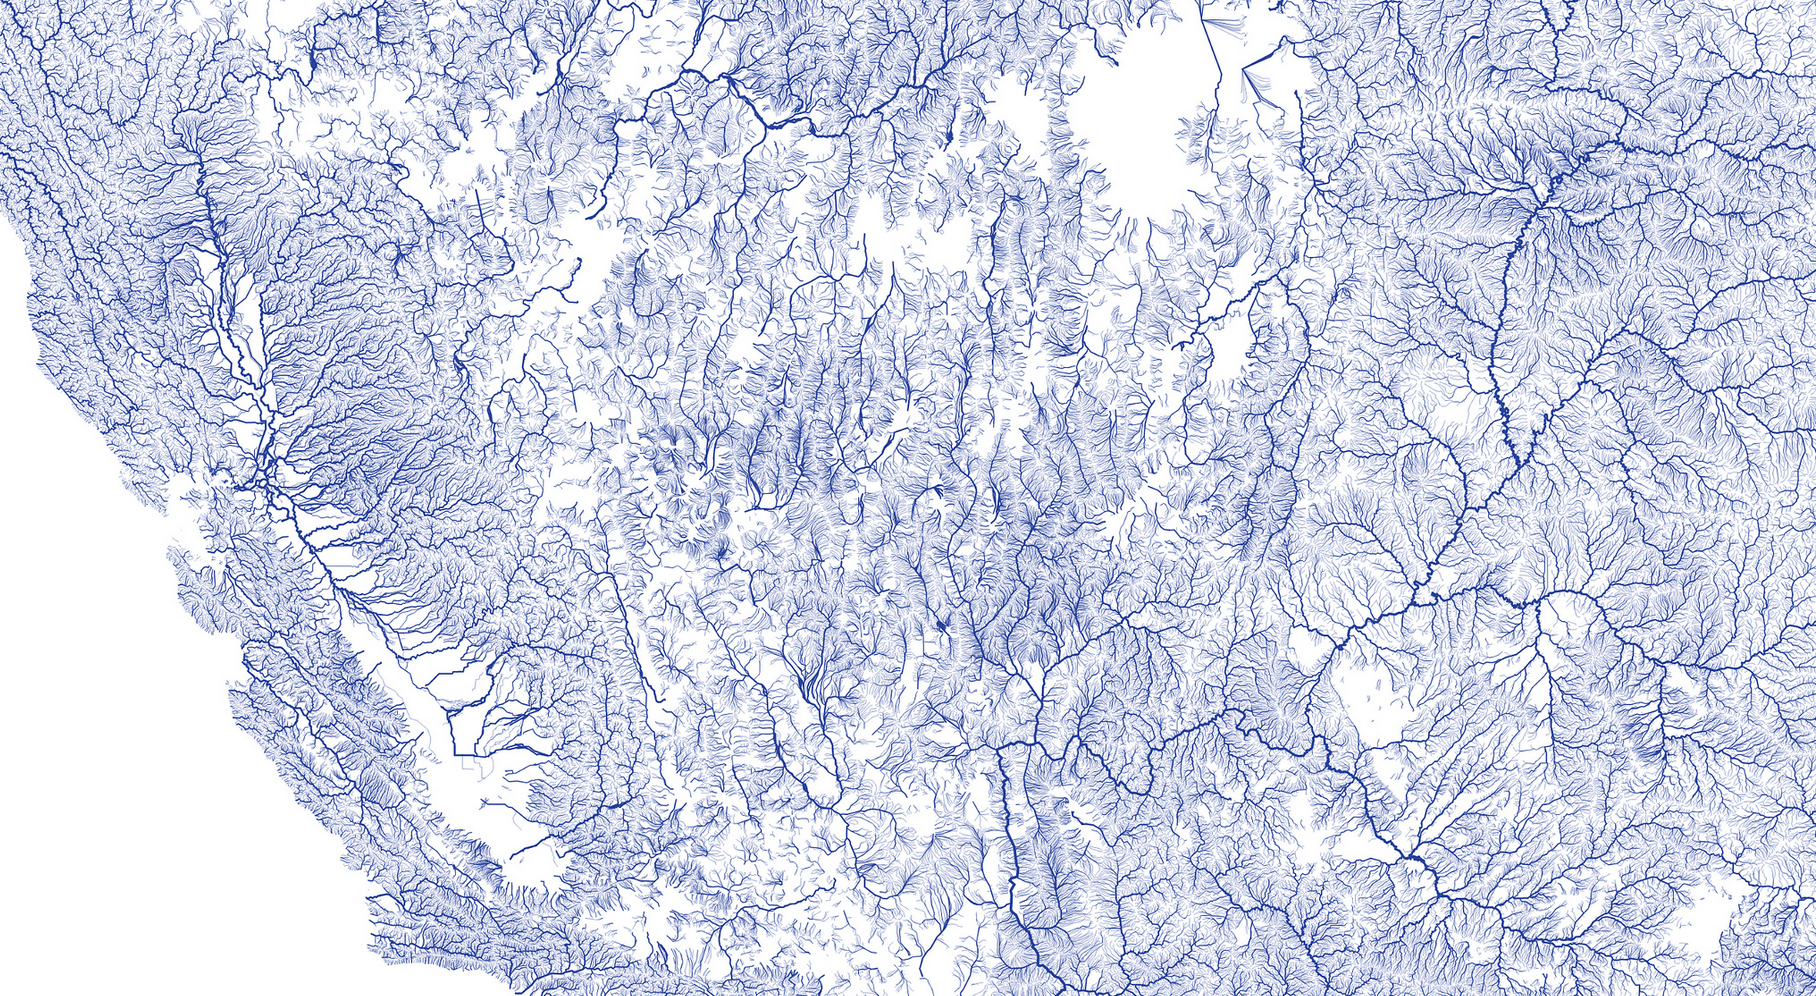
The above figures visualize the U.S. river networks using NHDPlus dataset and D3.js. The amazing beauty of these natural flow systems motivates us to ask such questions: why they are so beautiful? Are there universal laws behind these systems, like the law of gravity ? Or, is there a general “purpose” of these systems, like the principle of least action ?
Rinaldo (1992, 1993) et al. proposed a model called “optimal channel networks” (OCN) to explain the beutiful tree structure of flow networks. A comprehensive literature review on OCN can be found here. And this and this are two recently pulished papers on OCN.
 In the second plot there are two versions of global cost, depending on whether we put the futher points on the same line as the closer points.
The above figure is cited from here. The authors used this demo to explain the formation of river trees. They suggest a flow network has to minimize both of the global and local cost (in terms of flow dissipation, or energy dissipation cosidering potential energy, slope of basin, and many other factors). The spiral type minizes the global cost Lt, i.e., the total length of connections (assuming that the points are distributed uniformly in the space), but has a low effciency in transporting flow from individual points to the outlet. On the contrary, the explosion type minizes the local cost Lt_bar (average lenth of the path from a point to the outlet), but consumes too many connections. Intuitively, the best stragegy two optimize both of the global and local cost is to generate a tree type illustrated by the third plot.
Rinaldo et al. quantified the optimization goal, energy dissipation, in a very smart way. They define
as the area associated with the ith link on a spanning, loopless tree. The sum is over each upstream link j that inputs into i. As in the tree each link is associated with a unique site, Ai can also be viewed as the total number of sites “supporting” site i, like the number of employees under a head i within a company.
In Rinaldo et al.’s model, they assume that the potential engery dissipated in the ith link is
i.e., the production between water flow in the landscape (which is assumed to be proportional to the area Ai) and the elevation difference along link i (which is assumed to scale with Ai with an exponent gamma - 1 < 0 empirically). Ki is a quantity related to the property of soil such as erodibility. In homogeneous models we usually assume ki is independent of i and equal to 1.
The river networks will evolve to minimize the total energy dissipated, which is defined as
OCN suggested that the beatiful branching patterns we see in nature is acturally controlled by Eq.(3). In other word, we can say that flow networks have a common purpose to minimize Eq.(3), which is the driven force behind their evolution.
Optimal channel networks in details
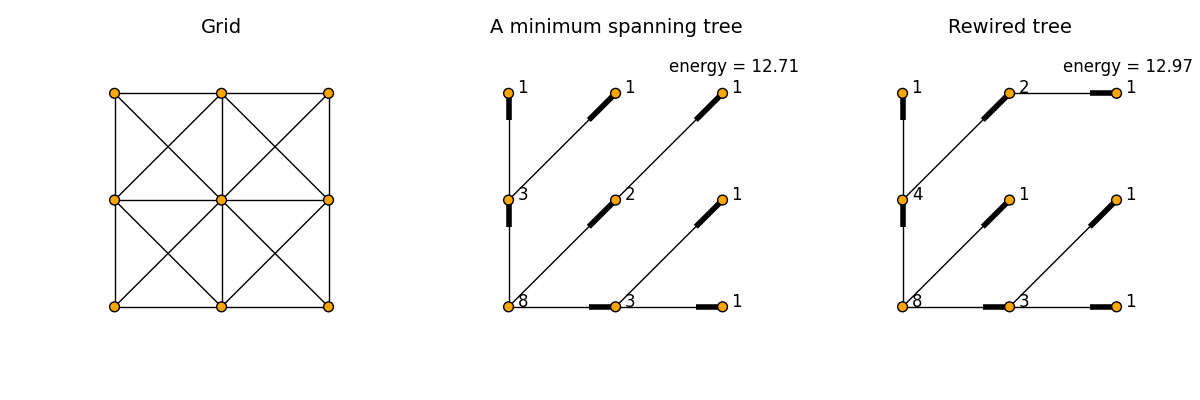
 A demo of OCN. The area Ai is shown next to the corresponding site i. The thinner side of the links shows the direction of flow. The total energy of the system is shown in the upper right corner.
Typically, OCN is defined as a tree on a 2D lattice of linear size L with only one global outlet. Each site on the lattice can only connect to one of its eight neighors. The above figure shows a lattice with L = 3 (left), an example random spanning tree obtained by Prim’s_algorithm(middle), and a rewired tree. A naive version of OCN is to use Greedy algorithm, i.e., generate a random tree and then randomly rewire the links of a node to see if the rewiring decreses the total enenergy E.

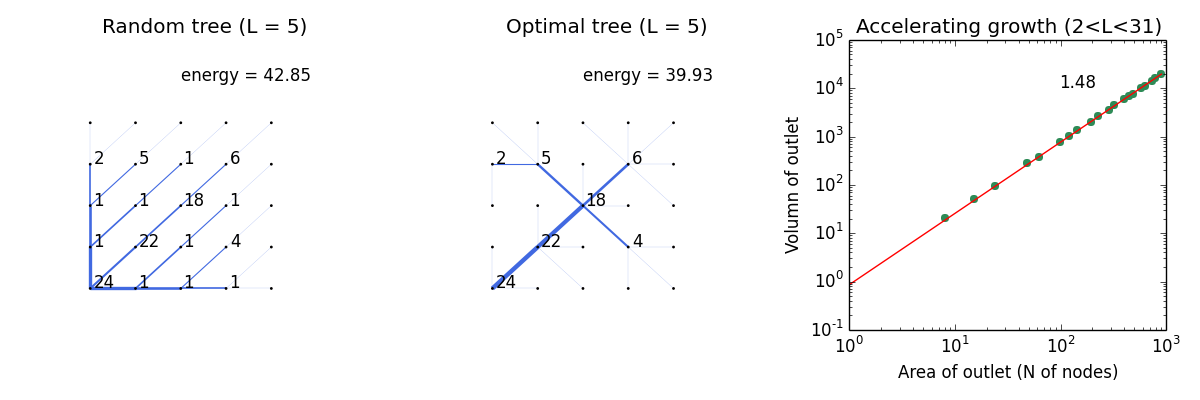
The above figure shows a random (left) and a optimized (middle) tree obtain in a lattice with linear scale L = 5, and also the super-linear scaling relationship between the volumn of outlet and the area of outlet (or the number of nodes) when L changes from 3 to 30 from 20 different sizes.

The above figure shows an optimial network obtain from a 50*50 lattice with 15k+ interations (about a hour). Does it look like the river networks of the U.S. ?